

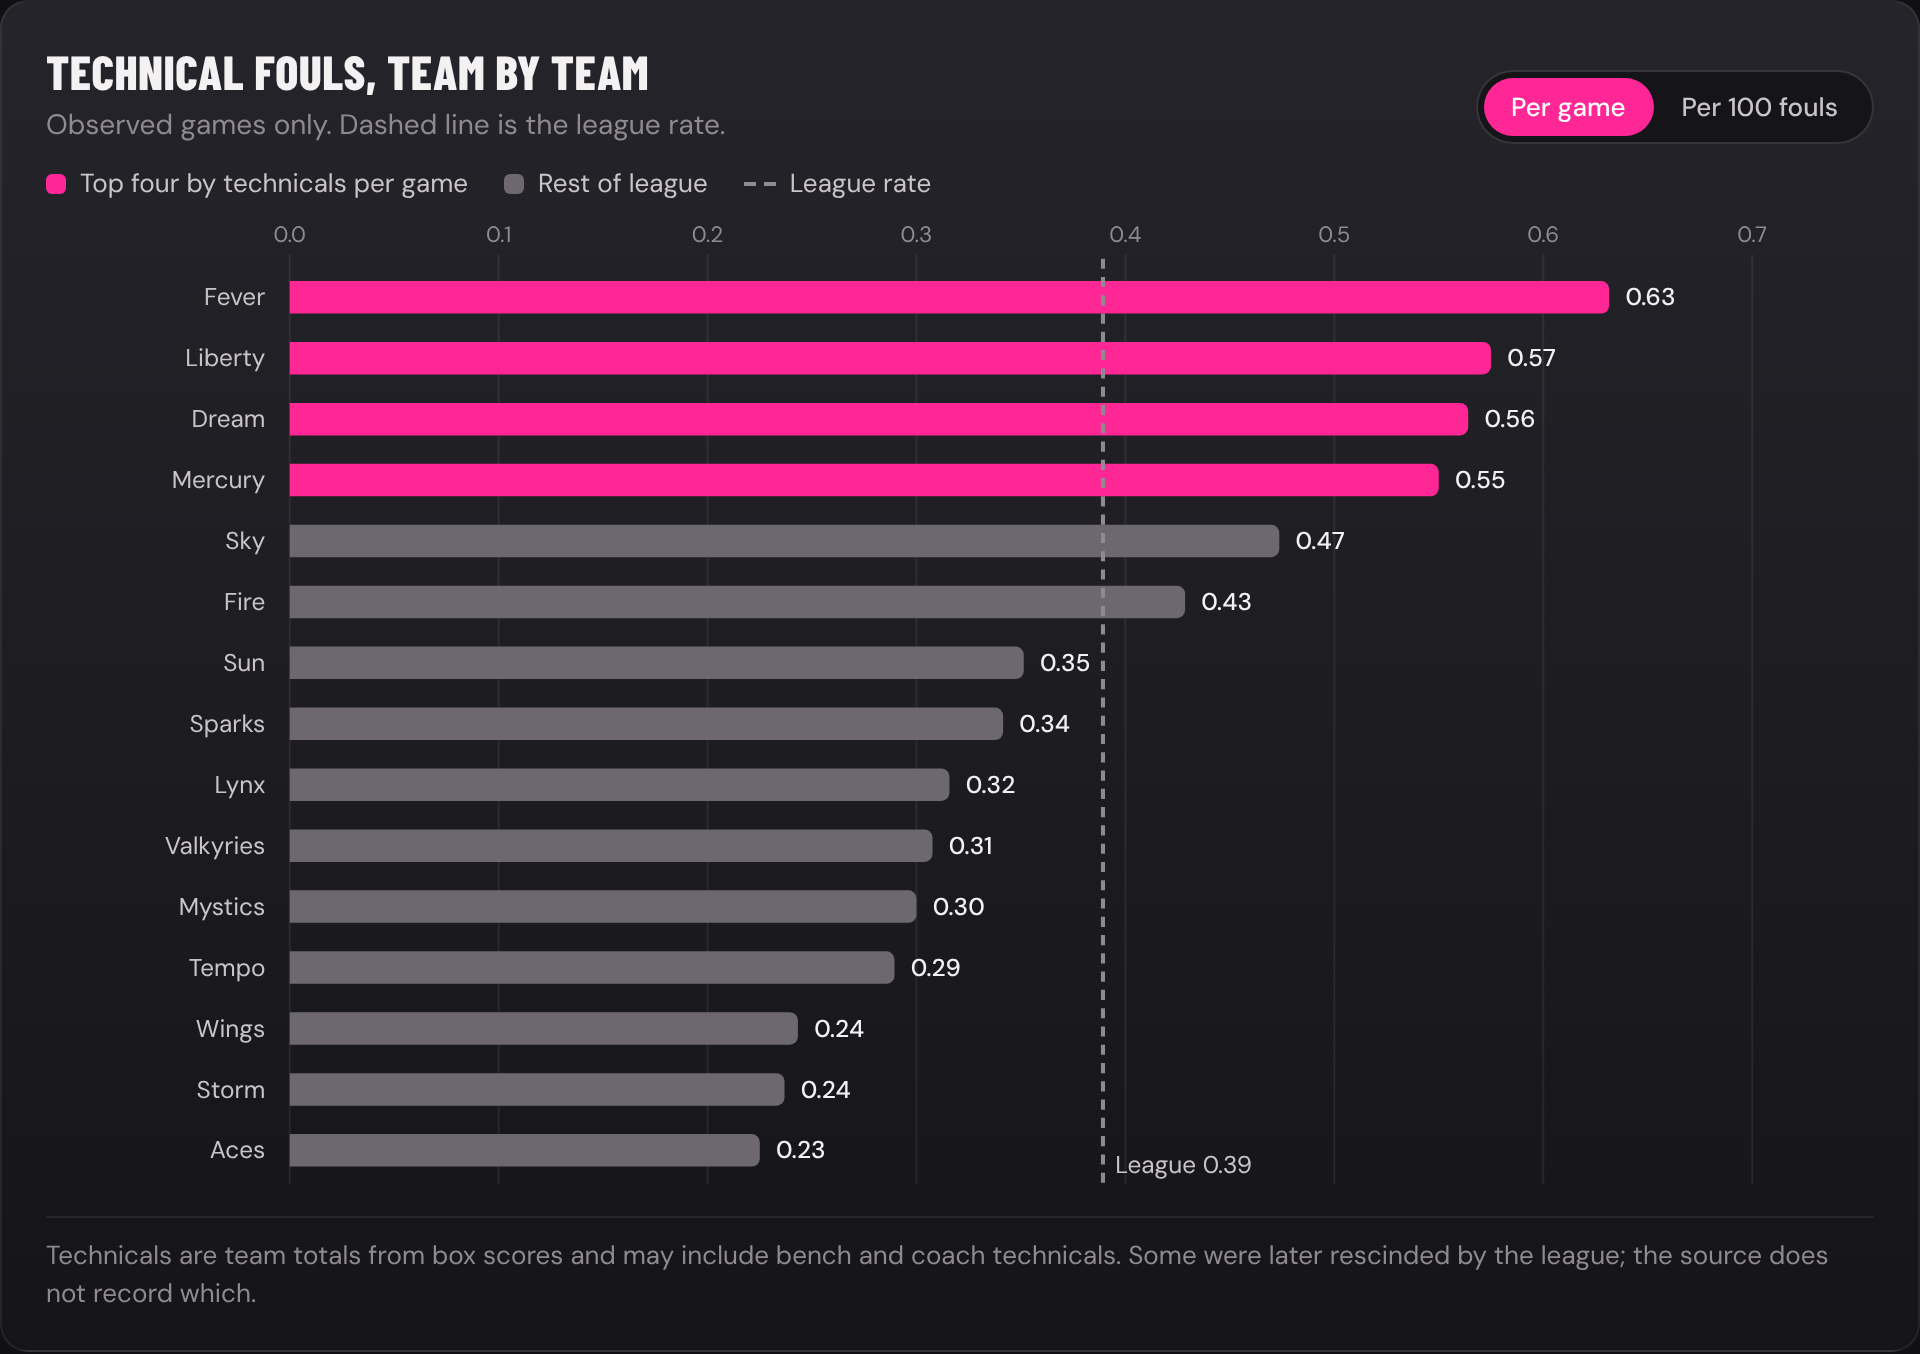
Indiana drew technical fouls at 2.8 times the rate of Las Vegas. Connecticut fouled the most and barely drew technicals. And the flagrant-foul leaderboard is mostly noise. WSEC’s Data Desk went through a partial audit of 289 of the 330 regular-season games.
A record season, even half-counted
The 2026 season was always going to produce more whistles. Two expansion teams, Portland and Toronto, pushed the schedule to 330 regular-season games, and the Boston Globe reported in August that the league was on pace to shatter its single-season technical foul record of 173.
The public box-score file this audit uses is missing 41 of those games and still counts 225 technical fouls. Whatever the full-season total ends up being after rescissions, it is past the old record. The more interesting question is where those technicals landed.
Four teams, one temperature
Indiana led the sample with 24 technicals in 38 games, 0.63 a night. New York (0.58), Atlanta (0.56) and Phoenix (0.55) form a tight pack behind them. At the other end, Las Vegas (0.23), Seattle (0.24) and Dallas (0.24) drew technicals less than half as often as the league leaders.
Is that spread real or just the bounce of small numbers? If every team drew technicals at the league-wide rate, a gap this wide across 15 teams would turn up only about 2 times in 100. So there is a real difference in technical-foul rates here, but a modest one. A few rescissions or the missing 41 games could reshuffle the middle of the table.
The top of the table lines up with the individual race. In August, Angel Reese (Atlanta), Caitlin Clark (Indiana) and Kahleah Copper (Phoenix) were tied for the league lead at seven technicals each, one short of an automatic suspension. Reese and Clark each had an eighth rescinded by the league within a day. Their teams rank first, third and fourth in team technical rate.
Measured per 100 fouls instead, New York moves to the top. The Liberty were a low-volume fouling team, but about 3 of every 100 fouls they committed came with a technical attached, the highest share in the league and two and a half times Seattle’s.
Fouling a lot is a different habit
Connecticut committed 22.4 personal fouls per game, the most in the sample, with Portland (21.9) and Chicago (21.2) close behind. Minnesota (17.8) and Las Vegas (17.4) fouled the least. Here the gap between teams is not in doubt: a spread like this would essentially never happen by chance.
But heavy fouling did not predict technicals. Connecticut sits in the high-foul, low-technical corner of the chart. Phoenix and New York sit in the opposite corner: below-average foul counts, well above-average technicals. Ordinary fouls measure how a team defends. Technicals measure something closer to temperament, arguments with officials, and taunting calls.
Counting whistles is easy. Explaining them is the hard part.
Ignore the flagrant leaderboard
Los Angeles recorded seven flagrant fouls in the sample, and Connecticut, Las Vegas and Dallas six each. Phoenix and Golden State had one apiece. It would be easy to build a story on that. The numbers do not support one.
At a league rate of about one flagrant every ten team-games, a team playing 40 games should expect roughly four, and anything from one to eight is ordinary luck. Every team in the sample lands inside that range. A spread this uneven happens by chance about 45% of the time. Until the data separates Flagrant 1 from Flagrant 2 and accounts for upgrades and rescissions, there is no flagrant story to tell.
The Finals, by temperament
The two teams still playing sit on opposite sides of the divide. Atlanta has the third-highest technical rate in the sample and committed five flagrants. Golden State ranks tenth in technicals and had one flagrant all season, tied for the fewest. Through five games of the Finals, the quieter team leads 3-2.
How we did this
- Team box scores for 289 of the 330 scheduled 2026 regular-season games (578 team-games), from a community-maintained public file. Preseason, postseason and All-Star rows are excluded.
- All rates are per observed game. The 41 missing games are left out, not filled with zeros.
- “By chance” comparisons use a Poisson model that gives every team the league-wide rate, then ask how often a spread at least as wide as the real one would appear (chi-square test across 15 teams: technicals p = 0.024, personal fouls p < 0.001, flagrants p = 0.45).
- This is descriptive. It does not show officiating bias, who started an incident, or whether a call was later overturned.
Sources: 2026 team box scores · WNBA 2026 schedule · Boston Globe on the technical record · Newsweek on the Reese rescission
Open the full interactive version ↗
Published on womenssec.com. Statistics referenced are as of the publication date.